Topic 5:
Regional & Southwest Climate Patterns
Announcements:
-
Field Wednesday -
Meet at lab room; need one or 2 people to drive private vehicles...
We're
going outside, so dress accordingly. Bring water,
rain gear, walking shoes, hat, sunscreen, tree book, lab handout, notebook.
-
Homework - Do Activity for Question 3 below!
MORE Announcements:
Learning Goals for
Day:
Ø
Understand how the location of
oceans (or other large water bodies) and mountain ranges affect
regional climate
Ø
Define the term “rain shadow”
Ø
Explain how the 4 abiotic factors
that define “climate” change as you go up in elevation
Ø
Homework: Describe the overall climate of
the Southwest, especially in terms of precipitation – based on your individual &
group summaries of precip. patterns at different locations in the SW
o
when is most moisture delivered?
o
when is it driest?
o
**what types of storms are most
likely to deliver moisture at different times of year?
Defining the Southwest:
Shaded relief map of the southwestern U.S.
(from:
http://rst.gsfc.nasa.gov/Sect6/Sect6_8.html )
Movement of moisture over the SW:
http://cimss.ssec.wisc.edu/goes/burn/wfabba/wfabba_rt66nmex.html
Question
1: How do mountain ranges affect precipitation?
Rain Shadows (The "Orographic Effect):
Question
2a: How do the four abiotic climatic factors change as you climb up a
mountain (go up in elevation)?

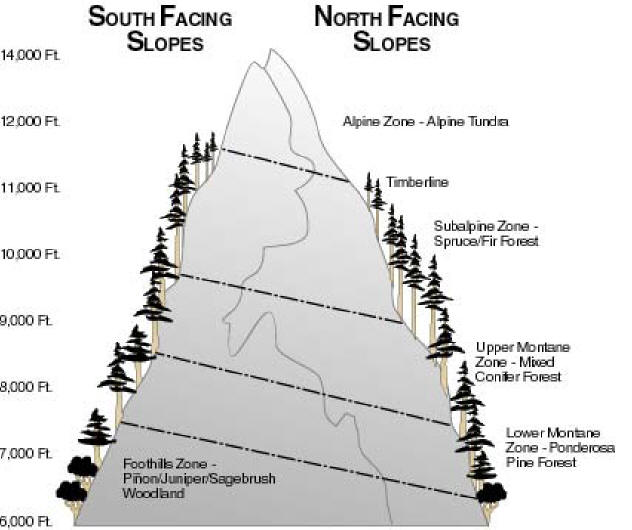
Temperature:
Moisture:
Wind:
Sunlight:
Question
2b: Why does
temperature change with elevation - is there a predictable pattern?
-
Adiabatic Lapse Rate : Change in
temperature of a moving air mass, as it rises or falls.
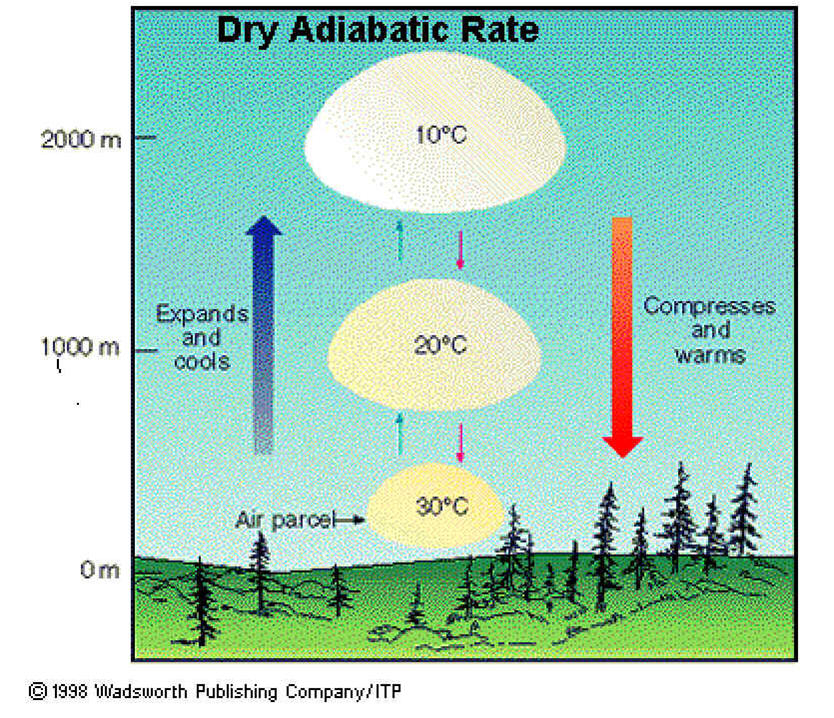
-
Dry Rate: 10oC/1000m (5.5oF/1000')
-
Wet Rate: variable, but lower
because along with cooling due to expansion, get heating due to
condensation (ave. wet rate = 5oC/1000m)
-
Environmental Lapse Rate for temperature change with elevation:
Change YOU feel in temperature as you move up in elevation through a
stationary air mass
-
the cooling is slower than for a
moving air mass
-
Ave. rate = 6.5oC/1000m
(3.6oF/1000')
-
Our elevation: 6500' (2250 m);
Andrew's Lake Elevation: 9500' (3250 m); so....?
Question 3: What is the climate like in the Southwest? In
particular, what are the patterns of precipitation here?
Small Group Activity & HOMEWORK
Activity Goals:
-
Practice interpreting & summarizing data
-
Use precipitation data from stations
around the southwest to look for recurring climatic patterns; data may
be accessed for all of Western US from this website: -->
http://www.wrcc.dri.edu/Climsum.html ; choose a site in the SW
- near the "Four Corners" region
-
Use the patterns observed to help
understand moisture delivery in the SW
-
For this exercise, each
person should choose a weather station from a site in the southwestern US:
Visit the Western Regional
Climate Center website: http://www.wrcc.dri.edu/Climsum.html.
The climate summaries you access contain data on mean total monthly precipitation.
-
Temperature data are
also provided, but we will focus on precipitation patterns today.
-
Using your carbonless
paper, plot the monthly precipitation data on a graph. What type of graph
(line, bar, other?) is appropriate for these data?
-
What information will
be presented on each axis?
-
A standard way to plot
monthly moisture data is by “Water Year” (as opposed to calendar year).
What are the standard beginning & ending dates for a "water year?"
And why would a “water year” be different than a standard calendar
year?
-
Once your data are
plotted, compare your graph with the others in your group. Are similar
patterns present across different sites/different regions of the SW?
-
When is the driest
month at most sites?
-
When is the wettest
month(s)?
-
What is the wettest
season? Is there more than one “wet” season?
-
What types of moisture
probably arrive during the different wet seasons, and what types of storms
deliver this moisture?
-
Do any sites exhibit a
“bimodal” moisture distribution? What does “bimodal” mean?
-
Be sure to include both the site
name & the site elevation (along with your name) in the
graph's title. (...and make sure the title is complete &
explanatory!)
Compare your results &
your answers to these questions with other groups in the class, and be sure
to put your original graph in your folder at the end of the class session.
Assess – Goals for
Day:
Ø
Draw a diagram of western North
America showing prevailing wind direction, locations of major mountain ranges,
and relative location of wet & dry areas. Where do rain shadows occur?
Ø
Review your & your classmates’
graphs of monthly precipitation distribution. The SW is often described as
having a “bimodal” precipitation pattern (meaning precip. occurs in 2 distinct
time periods or seasons). Does this make sense in light of the data you
summarized? How was that moisture delivered? (what kinds of storms)
Ø
When is the driest month of the
year for most of the SW? Why do you think this is the case?
9/15/06
Of Interest in the local News:
|
El Niño is back; skiers rejoice
Weather pattern likely to
bring heavy snow to the region
September 15, 2006
By Mary Jane
Carroll
| Herald
Staff Writer
The region's snow for this season already might have
been conceived by the atmospheric anomalies in the
equatorial Pacific. Translation: greater chances for
precipitation this coming November and December.
The National Oceanic and Atmospheric
Administration released a synopsis Wednesday stating
that El Niño conditions have developed and are
projected to continue into early 2007. Studies from
the NOAA Climate Prediction Center show that the
years of El Niño typically have a 106 percent to 141
percent higher precipitation in the early winter
months. |
|
|
