Results
(previous partial report assignment)
For this first Lab Report assignment, you will
write the Results section of a formal lab report, including both figures
(graphs), figure captions, tables, and the text to accompany and summarize the
results shown.
Note that this is an individual assignment;
you may not work with others on this assignment.
Please follow these steps:
- We will be using SPSS in our week 4 lab to
run some statistical analyses on the data we collected in Lab 2
- You will construct 4 graphs in Excel
summarizing the results and illustrating the results of the statistical
tests
- Each graph will need a clear, detailed
caption
- Ultimately you will create a minimum of 4
graphs and one data table, with captions (see Lab 4 for details)
- Put these into a formal Results section
format, by including brief paragraphs of text before each figure summarizing
the key points made by that graph or table.
- Use a paper from the primary literature as a
guide to remember how a formal results section is structured. Papers
to use for getting an idea of how to structure the Results include several
that are in my O: drive. e.g.:
Willette-Turtles-2005; Breshears-Drought-2005
- GRADING:
- 5 pts / graph with caption & results of
statistical analysis clearly reported
- 5 pts / data table with title
- 10 pts for summary text that is appropriate,
clear, error free
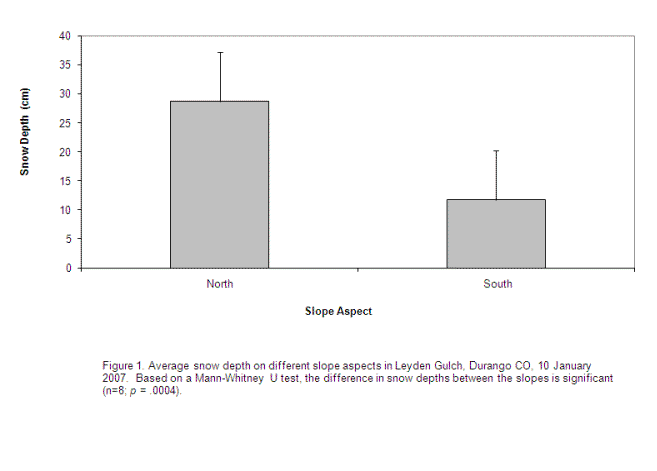
Sample figure with appropriate caption (i.e.
plenty of detail):


