| Matrix-less MALDI using
Porous Silicon (PS) |
|
We are currently exploring chemically
modified DC etched Porous Silicon (PS) as a matrix-less
surface for MADLI time-of-flight mass spectrometry.
Specifically, we are interested in the mechanism in
which energy is transferred to an analyte from the PS
surface through the chemical modification - i.e.,
through a molecular specie bonded to the silicon
surface. The photos show a 1cm x 1cm silicon wafer that
has been electrochemically etched to produce PS
(fluorescing under UV radiation) along with a 10micron x
10micron AFM image of such an etched surface. |
| RIMS detection of Metals |
For a number of years the group
has studied Resonance Ionization Mass Spectrometry
(RIMS) as a ultra-sensitive analysis technique for
metals of biological and/or environmental interest.
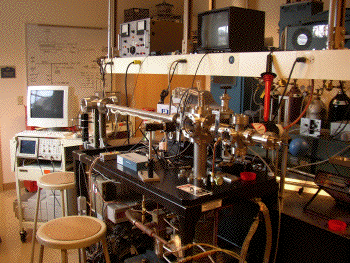
Students have constructed a linear time-of-flight mass
spectrometer for these studies and, in addition to
publishing this work, they have made poster and oral
presentations of their work at a variety of conferences.
In most cases the metal is driven to ionization via a
multiphoton transition via a dye laser. Occasionally the
spectroscopy facilitates the determination of such
things as internal (electronic) temperatures for those
species desorbed from surfaces by an initial laser pulse
prior to detection. |
 |
| Rugate filter chemical sensors in
Porous Silicon (PS) |
|
Eletrochemically (AC) etching doped
silicon under computer control can produce Rugate
filters of Porous Silicon (PS). The peak reflectance
wavelength can be tuned throughout the visible and
near IR. The area etched is typically 50% porous and
adsorption of species within the pores will change the
reflectance due to changes in the index of refraction.
Chemical modication of the PS can result in specific
chemical detection. The angle dependence of the
reflectance in these filters is demonstrated in the
following movie clip:
Angle
(MOV) or Angle
(AVI)
|
| Wavelet Analysis of Transient
Periodic Behavior |
I am also interested in using
wavelet analysis to discover trends in large data sets
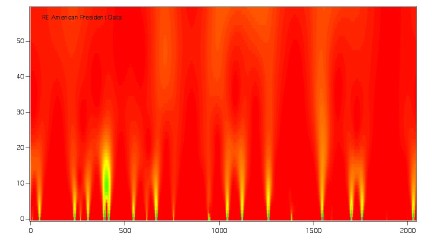
that are otherwise elusive. The image on the right is a
wavelet analysis (intensity-color) of inter-heartbeat
times, i.e., the time elapsed between heartbeats as a
function of scale of the wavelet (# of heartbeats - y
axis) and heartbeat # (x -axis). This is my heart data.
Using such plots, certain heart ailments can be detected
due to the absence of arches in the scale region of
about 10-30 (an anticorrelation of interbeat time
duration). Wavelet analysis has many interesting
applications - for example, it has also been used to
study the periodicity of the water temperature
variations associated with El Niño in the
Pacific. |
 |