Lecture Thirteen: Government
Budget and Expenditure Analysis – Overview
FYI About the Budget Process:
The U.S. Constitution (Article I, section 9,
clause 7) states that "[n]o money shall be drawn from the Treasury,
but in Consequence of Appropriations made by Law; and a regular
Statement and Account of Receipts and Expenditures of all public
Money shall be published from time to time."
The framework used by Congress to formulate
the budget was established by the Budget and Accounting Act of 1921,
the Congressional Budget and Impoundment Control Act of 1974 and by
other budget legislation.Prior
to the passage of the Budget and Accounting Act of 1921, the
federal government had no formalized process for developing and
producing a budget. The Congress set its own rules about
appropriations, changed them frequently, and left little room for
executive input.
1921 - The Budget and Accounting Act
created the Bureau of the Budget (later renamed the Office of
Management and Budget—OMB) in the executive branch and required the
President to submit an annual budget. It also created the General
Accounting Office (later renamed the Government Accountability
Office—GAO) to audit federal spending. The legislation swung
budgetary control away from the Congress. This greater presidential
role coincided with an increasingly large government and the
complicated budget process that accompanies such growth.
By the 1970s, many in the Congress felt the
President exercised too much control over the budget process. In
response to the Nixon administration’s use of impoundments
(a delay or withholding by the Executive branch of funds
that have been duly authorized and appropriated) and unauthorized
spending, Congress decided to implement a more formal means by which
to challenge him.
1974 - The Congressional Budget Act created
the Congressional Budget Office and directed more control of the
budget to CBO and away from the President's Office of Management and
the Budget. The Act passed easily as the administration was
embroiled in the Watergate scandal and unwilling to provoke
Congress.
Since 1974 - the Congress has passed a number of
laws regulating the budget process, but the Congressional Budget Act remains the
organizing framework. It created the House and Senate budget committees to
manage the Congressional process and specified that Congress create and adhere
to its own budget plan.
(source: Peter G.
Peterson Foundation):
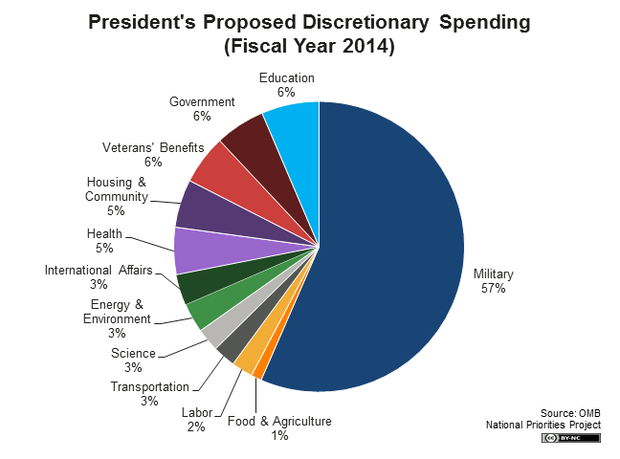
Let
Here's how President Obama proposes spending $1.15
trillion in
discretionary funding:
Discretionary Spending
Discretionary Spending is the portion of the
budget that the president requests and Congress appropriates every
year. It represents less than one-third of the total federal budget,
while mandatory spending accounts for around two-thirds.
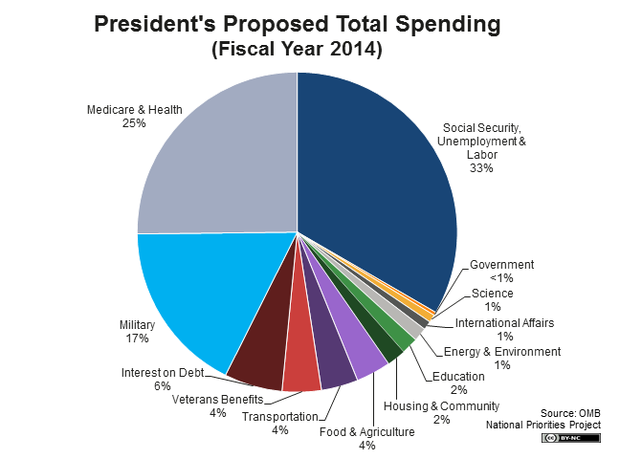
And here's the president's proposed allocation of
$3.8 trillion in total new spending in fiscal 2014:
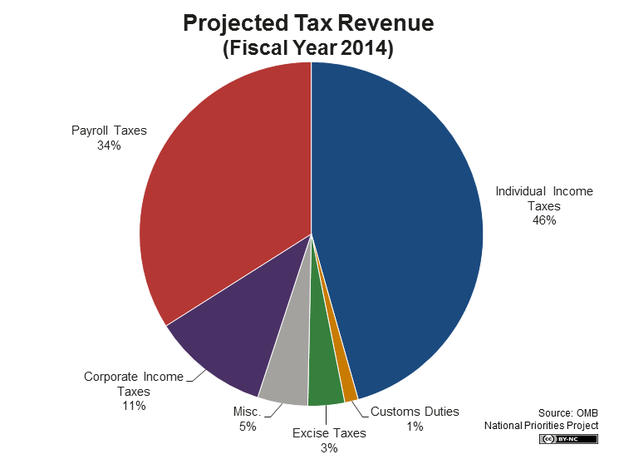
Taxes
The president projects $3 trillion in tax revenue
in fiscal 2014, an increase of 12 percent relative to 2013. This is in
part the result of a stronger economy and in part a result of changes to
the tax code. The budget proposes limiting tax deductions and loopholes
for the top 2 percent of income earners and includes a “Buffett rule” to
require that millionaires pay a tax rate of at least 30 percent;
together these tax increases would raise $580 billion over 10 years. The
budget also would make permanent tax credits targeted to low-income and
middle-class families, including the American Opportunity Tax Credit,
the Earned Income Tax Credit, and the Child Tax Credit.
The president does not propose raising new tax
revenue from corporations. The president’s budget proposes closing some
corporate tax loopholes and simultaneously lowering corporate tax rates,
a move that would not result in any new taxes on corporations.
Here's where $3 trillion in federal tax revenue
would come from in fiscal 2014:
If any of you are interested:
U. S. Budget Entities
http://www.whitehouse.gov/omb/budget/Historicals/
The
Government Budgeting Process:
The role of the budgeting process is to allocate scarce resources to their most
highly valued uses (value judgment). However, how does the government know
where this is without profits and losses to guide them? Since they don't, a
political process is used.
As
has been shown both theoretically and empirically, government planning fails
when trying to meet the basic necessities of life --
so when there is a lot of wealth to go around
due to market efficiency, politics gets more and more "interesting."
Why have a budget?
Congress may pass additional appropriations at any time it desires, which means
Congress is not constrained by the budget that it passes at the beginning of a
fiscal year.
Incrementalism:
Suggests that an agency's budget in one year will tend to be its last year's
budget plus some additional increment.
Taken at face value, the theory of incrementalism suggests that Congress and the
president do not exert very much control over the budgetary process. As a
result, the budgets of government agencies will
tend to be incrementally larger than they were the previous year.
Incrementalism and The Effects of Special Interests: Each program
has people who benefit from the program and who will therefore be very
knowledgeable about it. To eliminate or even reduce the program will harm these
special interests while perhaps benefiting the general public, but recall that
the general public tends to be rationally ignorant of most of what the
government does. As a result, political
pressure tends to work toward expansion rather than reduction of existing
programs.
1. It makes sense within the special interest theory - special interests want
to see appropriations to the programs that benefit them increased - thus
concentrated interests have more influence than the general public. Also, the
government must decide which interests to favor with budget increases. For
political reasons, the way to maximize political support is to spread the budget
increases around so that everyone gets something.
2. It also makes sense when the complexity of government spending is
considered, keeping in mind that there is no profit and loss indicator to
suggest where federal dollars are being best spent.
Actually, budgets for different programs vary substantially -
both for different agencies and for the same agency over time.
This suggests that incrementalism cannot be a
complete theory of the government budget process.
Must also consider:
Politics and the Federal Budget: See if you agree?
Until 1960s - national defense.
Kennedy and Johnson from 1961-1969 - change in priorities
Nixon - conflict began on priorities
Ford and Carter - weak presidents
Reagan - strong president - change in priorities and a lot of conflict
Bush and Clinton - less conflict, more politics
Bush - same but conflict increasing
Obama – politics and increasing conflict
Entitlements - hard to get
rid of and uncertainty in budgeting. Examples are government programs that
provide funds to those who meet eligibility requirements rather than
appropriating a fixed amount of money. Unemployment compensation, farm price
supports, Medicaid, etc.
Off-Budget Expenditures -
should be included - creating government-owned corporations to administer
activities and giving those public corporations budgets separate from the
government's budget. (Post Office, Social Security, Amtrak).
Government Expenditure Analysis
Involves using economic theory to determine the consequences of government
expenditure programs.
But
since government spending programs take many different forms, there is no
general analysis that can be used in every case. The consequences vary greatly
depending upon how the government spends the funds. Therefore, it is somewhat
necessary to do a case by case analysis.
But
generally speaking, public finance economists break the economic effects of
expenditure programs into two categories: allocative and distributive.
Allocative effects
refer to the way an expenditure program affects the pattern of goods and
services produced by the economy.
Example: Does a particular subsidy lead to an increase in the output and
consumption of the subsidized good?
Distributive effects
of government expenditures refer to their impact on the distribution of real
income or well-being. Or – who benefits and
who loses from the programs? Many government expenditures benefit
some at the expense of others and therefore redistribute income. From whom and
to whom the income is going is important. The results are often not what
proponents of a program intended, although sometimes they are but the proponents
want their true motives hidden.
This is often known as cost/benefit analysis. The problem, as we
all know by now, is measuring the costs and the benefits. Typically, it is
again assumed, that a dollar is valued the same by everyone. As economists, we
can often determine who gains and who benefits monetarily – but can’t go much
beyond that (except to make value judgements).
There are three basic types of government expenditure programs:
1.
Expenditures on nonmarketed goods
– goods and services that supposedly would not be provided by private markets
(or, if provided, would be provided in negligible amounts). Examples supposedly
include defense programs, foreign aid, space exploration. These are not “public
goods” necessarily, but are restricted (or mostly restricted) to government provision for one reason or
another. However, note that space exploration is becoming more and more a
private marketed good.
2.
Fixed-quantity subsidies
– the subsidizing of goods and services that private markets provide. The
subsidy does not depend upon how much is bought, it is fixed. Examples include
subsidies for education, food, child care, job training, energy, farm products,
medical care, etc.
3. Excise subsidies – the government pays part of the per unit
price of a good but allows the quantity of the good to be determined by consumer
purchases. The subsidy is not fixed, it depends upon the amount of the good
purchased. Just the opposite of an excise tax. Examples are harder to find –
but the most common are found in special provisions of the tax laws (the more
house you buy, the fewer taxes you pay). Also, some welfare programs - the more
medical care an old person consumes, the more subsidy they get.
Let's Analyze
Expenditures on Non-marketed Goods
Since these goods are often not provided by markets, there is no available
“measure” of the value of the good to the public. This limits the analysis.
But a few points can be made:
There are two ways the government can spend to stimulate output of some good
that is not provided by private markets.
1. Pay private firms to produce the good – the government expenditure
represents a market demand for the good that gives private firms the incentive
to produce it (airplanes and guns).
2. The government hires the resources itself and oversees the production
directly (the post office).
Allocative
effects:
Whichever method is used, the allocative effect
is to increase the output of the desired good. Moreover, in both cases,
resources that would have been used to produce other goods in the private sector
are used instead to produce goods in the public sector. Thus, we get more of
one good and less of others. In other words, there is an opportunity cost
to the public sector goods.
Seems like a simple point but is often overlooked. Government provided goods
and services, even though they are not sold directly to the public, are not
free.
The question is:
is the benefit associated with the government supply equal to, greater than, or
less than the opportunity costs associated with the private sector?
GRAPH: Allocative Effects of Government Provision of Goods:
Distributive Effects:
Just as the overall benefit to the public is difficult (impossible) to determine
– so are the distribution of benefits and costs to different individuals or
groups.
There are not market prices to register values that people either individually
or collectively place on this type of good. Outdoor enthusiasts probably
benefit more from national parks than other groups do. Since we can’t determine
(measure) people’s subjective preferences, little can be ascertained about the
distributional impact of providing the good. Also, since most of these goods
and services are financed through general funding – it is also difficult to
determine where the cost lies.
If we know who pays
the tax and exactly who benefits -- we can point out the reallocation of money -
that's about it.
Production Inefficiency:
The opportunity cost associated with the production possibilities graph is the
minimum possible opportunity cost. Only if the government output is
produced in the least costly way will the loss in private goods (on the graph)
reflect the actual cost (remember, the cost is measured in dollars and cents or
actual physical output). In other words, when the government takes the
resources that would have been used to produce the private goods in order to
make goods itself – there is most likely NOT a one to one tradeoff. The
sacrifice is larger – we could end up inside the production possibilities
curve. This doesn’t mean, as you probably learned in principles class, that
resources are necessarily unemployed. They are not being used as efficiently as
they could be.
Government sector output is sometimes produced inefficiently. Some studies:
(sources on request)
Richard Muth estimated that public housing projects cost about 20 percent more
to produce than comparable housing built privately.
E.
S. Savas, in a study of garbage collection in 260 cities, found that the cost of
garbage collection provided directly by municipal governments was about 50%
greater than when the same service was provided by private firms contracting
with cities.
Roger Ahlbrandt found that the cost of providing fire-protection services in
Scottsdale, AZ, where they are provided by a private firm under contract to the
community, was 47 percent less than the cost in comparable communities where the
services are provided directly by the government.
Dennis Mueller found that after doing a survey of 50 studies comparing public
and private provision, “in only 2 . . . were public firms found to be more
efficient than their private counterparts . . . The evidence is that public
provision of a service reduces the efficiency of its provision seems
overwhelming.”
Reason: The rules of the game.
Rules
®
Incentives
®
Actions
®
Outcomes.
Incentives confronting decision makers in the political process are different.
Designing government expenditure programs so that the relevant decision makers
have an incentive to produce in the least costly way is difficult without the
profit motive to guide us.
In
some cases, it may be feasible to have the government purchase the good from
private firms. Because firms are profit oriented, they have an incentive to
produce in the least costly way. Even here, though, some forms of government
spending, such as sealed bid contracting and cost-plus contracts, have led to
inefficiency (why?).
The fundamental point
is that expanding government sector output involves opportunity costs in
sacrificed private sector output, and sometimes this sacrifice is larger than
necessary.
As the size of the slice of pie going to government grows, the pie gets smaller
(ceteris paribus).
The
Role of Taxes:
What role do taxes then play in the analysis of government expenditures?
Actually, expenditures have an opportunity cost irrespective of how they are
financed.
On
our production possibilities frontier – there would be a loss in private output
regardless of whether the government:
a.
Taxes
now
b.
Borrows
(taxes later),
or
c.
simply prints money
to
finance the spending – because real
resources are used to produce the goods and services. Nonetheless,
taxes are most often the tangible cost, and it is convenient to think of the
opportunity cost of government spending as reflected in the taxes needed to fund
the program.
The exact role of taxes in financing government spending is twofold:
First, the tax (or other method of finance)
determines the composition of the sacrificed output in the private
sector – that is, what exactly is lost from the private sector (cars, homes,
food, recreation) depends on the exact method of funding. A tax on cars, for
example, would obviously concentrate the reduction in output more on cars than a
tax on food would. However, the overall reduction in output would be the same.
Second, the tax would also determine (or
give us an idea about) who will bear the opportunity cost.
Although the opportunity cost for the community is the overall loss of
productivity, different taxes will distribute this burden differently among the
public. For example, a progressive income tax would place a larger share of the
cost on high-income families than would a tax on food.
Clearly then, the precise method of finance used has allocative effects (what
goods are sacrificed) and distributive effects (who sacrifices these goods) of
its own.
To do a complete analysis of a particular government spending program – we
should look at both tax and expenditure policies simultaneously. However, this
is sometimes not feasible because expenditure programs are not linked to
specific taxes (as we discussed earlier).
Overall Efficiency Considerations:
Remember - what is efficiency? How should it be defined really? Efficiency and
value go hand in hand -- and therefore we can't talk about efficiency without
talking about
people’s
wants.
We have assumed that we are operating on the production possibilities frontier -
the standard textbook analysis assumes that there is = efficiency everywhere
along the frontier. This is WRONG.
GRAPH - EFFICIENCY AND THE FRONTIER
Certainly
(as we have seen),
the private sector output must fall when government spends (uses resources).
There is this opportunity cost. But we also move to another point on the
frontier. Is it more efficient?
As we talked about earlier – from a production point of view – most likely we
end up losing even more private sector goods – not efficient
(measured in terms of actual physical output).
But: we also don't know if the production of government goods over private
goods is "efficient." -- Each point on the frontier represents a different
"bundle" of the two types of goods. Certainly not be "efficient" or
"productive" if we are producing goods and services that are of less value.
So where we are on the curve is also important.
Is it efficient from an allocative perspective?
How you answer that depends on what roles you think government should play and
if those roles actually accomplish what they claim to accomplish.
What if the economy is operating inside the frontier?
A government expenditure program could conceivably result in a move to a point
on the frontier, employing previously unemployed resources to produce the
government output. This would not reduce output in the private sector – so
there is no opportunity cost – right?
Wrong: This is a common error that comes in many forms. The error lies in
failing to understand that the notion of opportunity cost relates to alternative
uses of resources. The alternative to using the unemployed resources in the
public sector is to employ them in the private sector.
This could perhaps be accomplished by a tax reduction, lowering of interest
rates, an increase in cash transfers by the government – give tax revenue back
to the private sector somehow, or lower regulation, depending upon the
economist’s view of government.
The
opportunity cost of increasing government output is thus correctly viewed as the
same cost as before even if resources are initially unemployed.
More Common Errors:
Government and job creation:
here lies a similar error. Government employment of workers in public works or
other programs does not create jobs; instead it simply induces people to work
for the government rather than in the private sector. Government spending
diverts workers (and other productive resources) to the government sector. This
is true even when the workers are initially unemployed.
The
important question is whether the workers’ services are more valuable in the
government sector or elsewhere, and the concept of opportunity cost forces
us to face that question.
Government expenditures and inflation:
An expenditure program is not “intrinsically” inflationary if taxes are used to
finance the program. If taxes are not used and the government prints money to
finance the program, inflation can result – due to the change in the money
supply, not the government program.
Inflation is a tax that reduces the value of cash balances. So one might object
to the way the program is financed, but not the spending program itself.
Inflation used to finance government programs can be much more harmful than a
different type of tax.
Conclusion: the real effects of government spending programs can be found when
examining the combined impact of monetary policy and all taxes and expenditures.
Summary - Taxation
and the Analysis of Expenditures
In
evaluating the efficiency effects of government spending, it should be kept in
mind that the fundamental issue is whether the spending program together with
its financing method leads to a more or less efficient resource allocation.
Normally, taxes will provide the funds that are spent, and we need to
consider somewhat more carefully how taxation is integrated into the analysis of
an expenditure program.
Central
point: every dollar the
government spends imposes a cost on taxpayers of more than a dollar.
There are several reasons for this.
1.
Administrative costs associated with collected tax revenues.
2.
Compliance costs borne by taxpayers – the time and resources required
to comply with the tax laws.
3.
Probably more important – resource allocation distortions – due to
less efficiency, these costs are very important but often over-looked.
These
costs (and possibly others) can be combined and referred to as the
marginal
welfare cost of taxation. The
meaning is, as already stated, that each dollar spent by the government has a
cost of greater than $1 on taxpayers.
For
example, if marginal welfare cost is 25% of revenue, than each dollar spent
costs the public $1.25 -- $1 of which is the direct cost of the revenue and the
other $0.25 of which is the marginal welfare cost.
These
costs have important implications for evaluating the efficiency of expenditure
policies. We have basically ignored
them in our analysis – thereby, for example, our analysis makes consumers
better off than they actually are (since we have ignored a cost).